Defect Map – an attributive control introducing the notion of fault location (2/2)
Attributive control of aspect defects in an SPC approach is done using the classical attribute tracking charts NP (number of non-conforming parts), C (number of non-conformities), P (proportion of non-conforming parts) or U (proportion of non-conformities per unit).
If a C-card is used for high value-added parts in 100% control, the evolution of the number of defects per part will be followed. In some cases, this monitoring is sufficient. On the other hand, one can imagine other cases for which the information on the number of defects is not sufficient.
To overcome this lack, the notion of defect location (or defect map) can be introduced for attributive controls. Instead of only documenting the presence of the defect, the location of the defect on the part is also documented.

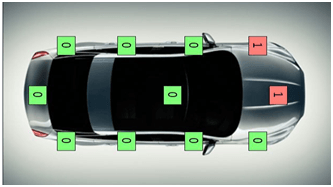
The image above shows a well-known possible application of attribute tracking using defect mapping. In the image, a car rental company reports the defects encountered when a customer returns his rental car. In this example, the car hire company finds two defects: a first defect on the bonnet, a second defect on the left front wing.
In the industrial field, one can imagine a multitude of applications that require knowing where a defect is, in order to be able to decide whether or not to reject a part.
In aeronautics, we may accept a crack that is located in an area of low physical stress. On the other hand, the same crack will lead to the part being scrapped if it is located in an area that is subject to high physical stress.
For a watch manufacturer, a scratch can be accepted if it is in a non-visible area of the final part. However, if the scratch is in the middle of the bezel, which is clearly visible to the customer, the same defect would lead to the part being scrapped.
The examples given above show cases where the location of a defect plays a determining role in the decision to scrap or not a part. One can also imagine cases where additional information for the defect (defect length, defect area) is important for the decision.
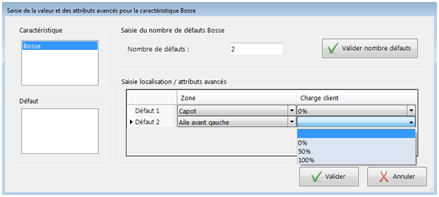
As with its location, one could ask to specify each defect with a defined amount of additional information.
Depending on the size of the scratch or impact on the bonnet, the lessor’s decision will not be the same: he may accept the return as it is, or he may request a repair and invoke the insurance.
It is therefore up to him to characterise these defects, either by classifying them (small, medium, large), or by measuring them (15mm long scratch).

In some areas, a crack can be considered acceptable if it is shorter than four millimetres. If it is longer, the part should be discarded. For a glass manufacturer, an iridescence can be considered as not disturbing, if its surface does not exceed 5mm².
All these examples illustrate the possibility of using a Defect Map to make the right decisions when it comes to deciding whether or not to scrap a part. If you limit the use of a defect map to this decision support, unfortunately you will not see a reduction in the number of defects.
How can we take advantage of this additional information (location, characterisation) to help reduce the number of defects?
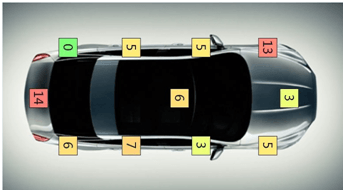
Let’s imagine that our car hire company now « superimposes » the defects found for all the cars hired during a certain period. The result is a defect map that shows in which areas of a car the greatest number of defects are found.

Looking at the above map, he could take corrective action to limit the number of impacts in certain areas and ask for the installation of reversing radars to limit the problems on the rear of vehicles!
Taking this example to the industrial domain, we can see that with the help of the Defect Map, we can easily identify areas that often have defects and look for the cause for this accumulation. By eliminating the identified cause, a reduction in defects is automatically achieved.

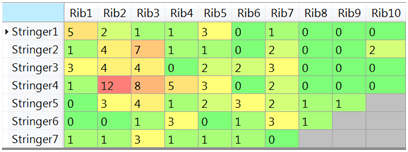
By superimposing a production batch (e.g. the 20 pieces of the week) we realise that we have a zone which concentrates a large number of defects (R2-S2 to R3-S5): we would not have realised this by examining the pieces 1 by 1!
To conclude, we can reinforce the statistical aspect of the attribute maps:
- we add information on defects (which allows us to obtain analysis information more quickly, with a smaller number of parts)
- by « superimposing » the Defect Map on the parts, we recreate a sample effect, and we can allow for monitoring and evolution over time.
Frédéric Henrionnet
Quality Assurance Manager, Infodream
Andreas Völker
Product Manager, Infodream
Learn more about Qual@xy SPC
Learn more about Defect Map
