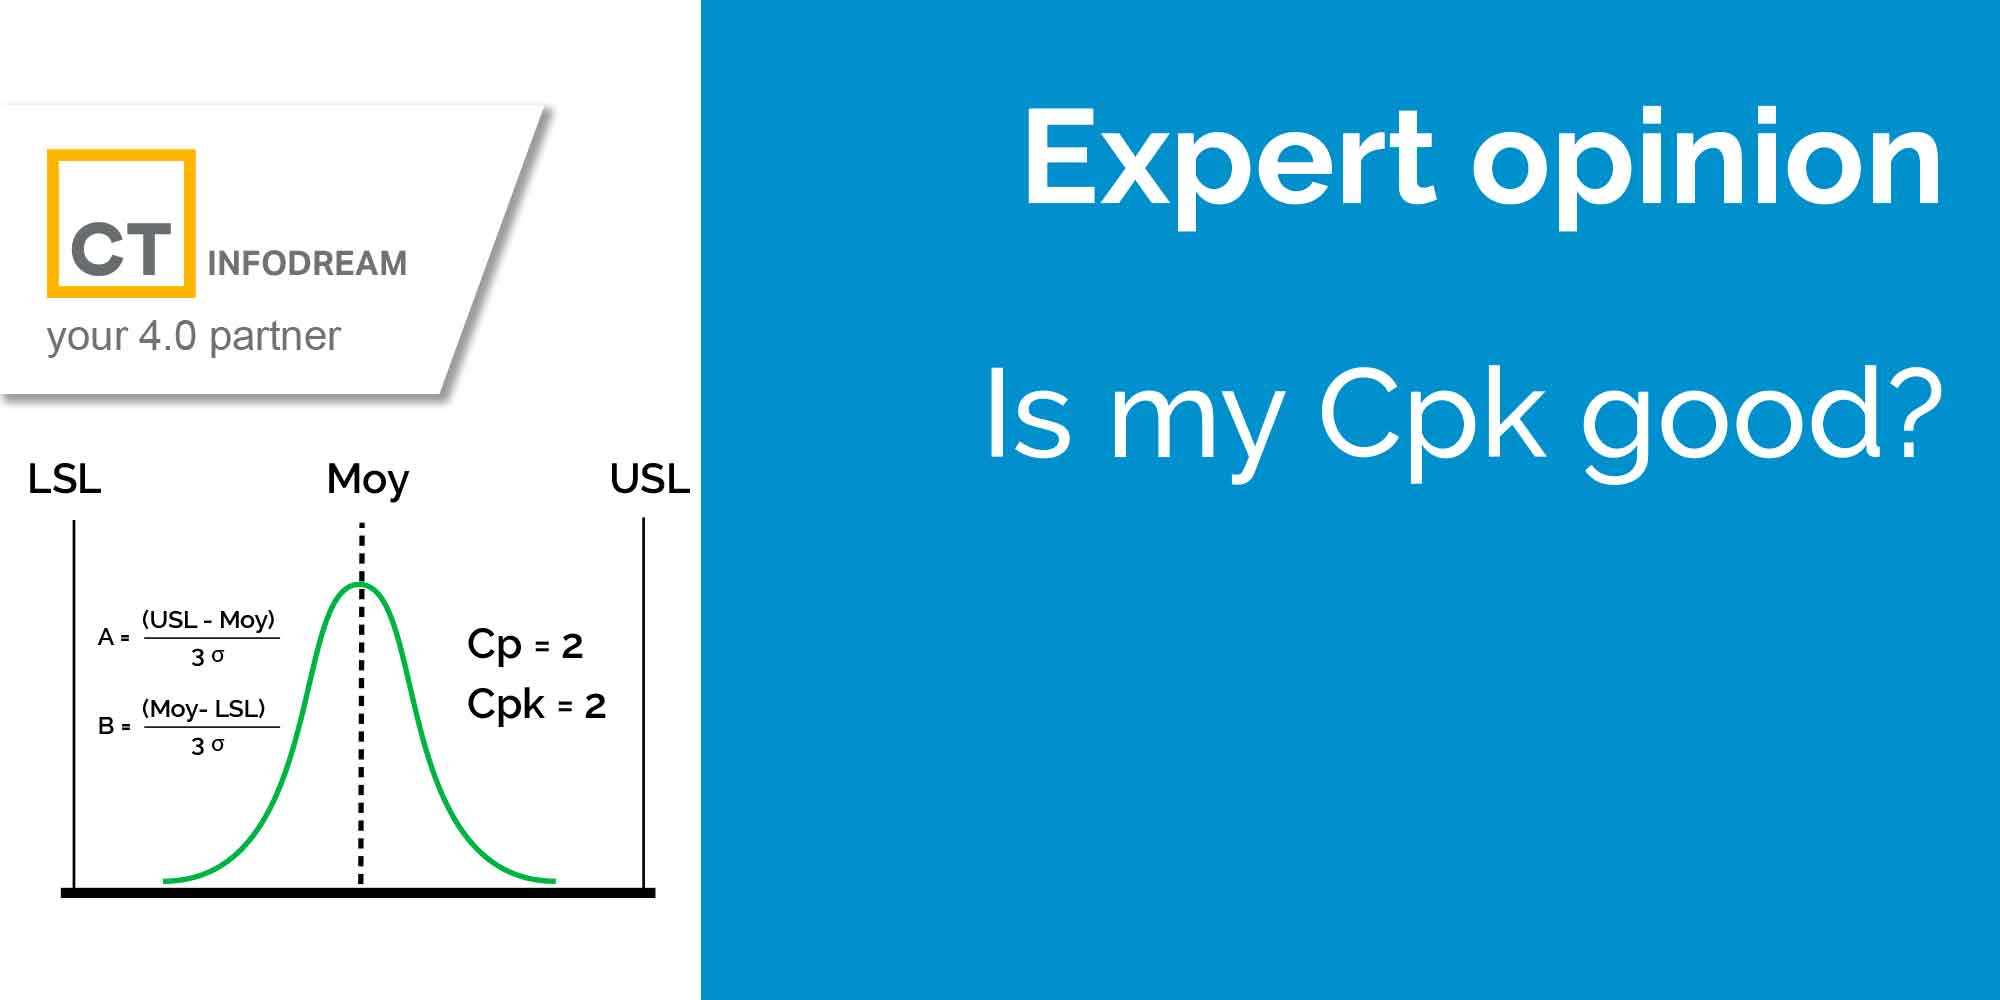
Is my Cpk good?
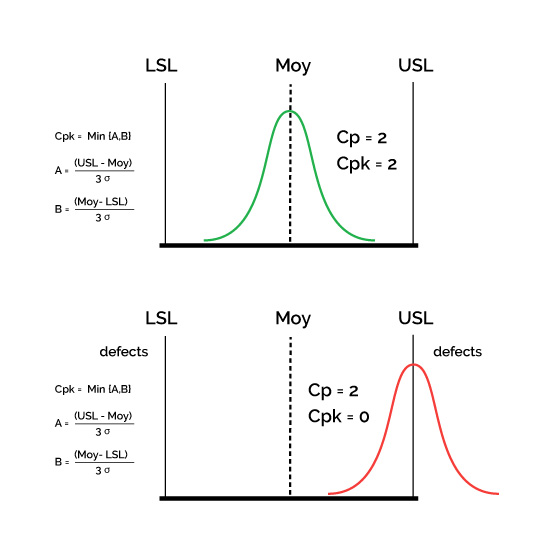
The Cpk is a process capability indicator that measures the deviation from the average.
Is a Cpk (or Ppk) good, insufficient or bad? In relation to what?
Firstly, in relation to a contractual value or a requirement in the specifications: « a minimum capability of 1.6 is required for such and such a dimension ».
It can also be in relation to standard values in the trade or normed according to the type of characteristics: minimum Cpk of 2 for a safety characteristic, of 1.6 for a functional characteristic, of 1.3 for the others, etc.
Whatever the limit or objective value, whatever its origin, it must obviously be respected, since it is contractual or normative. But am I really bad if I have a Cpk of 1.5 for an objective value of 1.6?
The objective values (1.33; 1.67; …) are not values « pulled out of the hat ». They correspond to risks (customer risk and supplier risk) that we agree to take, and therefore to a level of confidence that we grant to the statistical validation of our production.

My current production, which obtains a Cpk of 1.5, was in line a few years ago when I had a target Cpk of 1.33 and is no longer in line at all now that I have raised this target to 1.67! However, the same parts are coming out, with the same quality level…
The validation of the quality obtained in relation to the objective is essential for the company, since it determines the acceptance of the customer, but at the « pure production » level, it is not the most important thing. What needs to be monitored and validated is that the capability level is maintained or improved over time. For production, the evolution of capability is more important than its actual value at a given time.
My capability was what it was last month, but it has increased since then: we have therefore made progress in quality. Is this progress sufficient to reach the objective or not, that’s another question… On the contrary, my capability has suddenly deteriorated this month: maybe I’m still above the objective (from 2.5 to 1.8 for example), but this sudden deterioration indicates something: a change in the material? a machine problem?
Qual@xy SPC allows you to compare indicator values calculated over periods of time that you choose, and therefore to compare one period with another.
In the same way, the Qual@xy Dashboard module allows the automatic calculation of the evolution of Cp, Cpk, TNC, average, … dimension by dimension and week by week, or month by month, or time period by time period. It is the ideal tool for « long-term » monitoring.
Frédéric Henrionnet
Quality Assurance Manager, Infodream
