Various articles published here have already explained the concept of SPC (Statistical Process Control) and its benefits for any production process.
Traditional SPC is focused on sampling the production but in some processes 100% inspection is used. This could be for various reasons including controlling safety critical or high value parts, or due to automation where inspection is integrated into the manufacturing process and done automatically.
In these cases we have to ask ourselves what purpose traditional SPC serves? There is no sampling of production parts and nothing to estimate as all parts are measured and their compliance known. Therefore, what are the benefits of SPC?
In 100% inspection, all non-conforming parts are detected and discarded (in theory), and from the measurements we can calculate real population average, standard deviation, and actual non-conformances! So, it would seem that SPC adds very little as there is nothing to estimate, predict or to model.
The surprising answer lies in change management and culture. 100% inspection drives a static/stagnant culture with an emphasis on COMPLIANCE – Is the part OK/NOK. However, if we want to continually improve and better understand our processes then an SPC approach (with its preventative focus) helps create a dynamic culture of process improvement, evolution and innovation.
On one hand there is static control for the customer: a snapshot of production, with only the compliant parts, and on the other side a dynamic control for the producer: a production film!
Coming back to the theoretical basis of SPC: we want to control the manufacturing process instead of the product.
The use of SPC will also bring other benefits:
- Reduce the notion of binary tolerances and focus on process variation (This is what causes problems to our customers)
- Improve the capability of the manufacturing process (and not rely on the robustness of the inspection process)
As previously mentioned, ongoing 100% inspection is normally implemented for 2 main reasons:
1- High value parts made in low volume.
2- Automated measurement, sometimes at very high production volume.
A third case for 100% inspection is the short-term containment of non-conforming product for specific quality outbreaks until the root cause and preventative action is implemented but this is outside of todays scope.
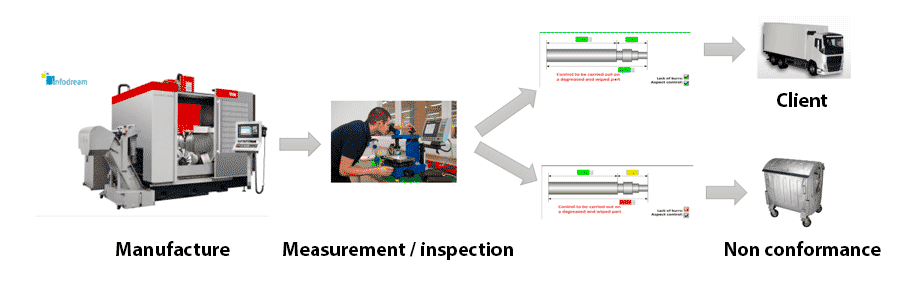
1: High value parts
100% inspection is performed on this type of production because a non-compliant part will not be systematically rejected due to their value: they will be retouched or « reworked », or down-stream processes modified to ‘make them fit’. It will be important to keep the measurements at these different steps: the capability of these measurements before rework reflect the « real » capability of the manufacturing process, the capabilities of the rework measurements are only the capabilities of the parts I deliver to my client.
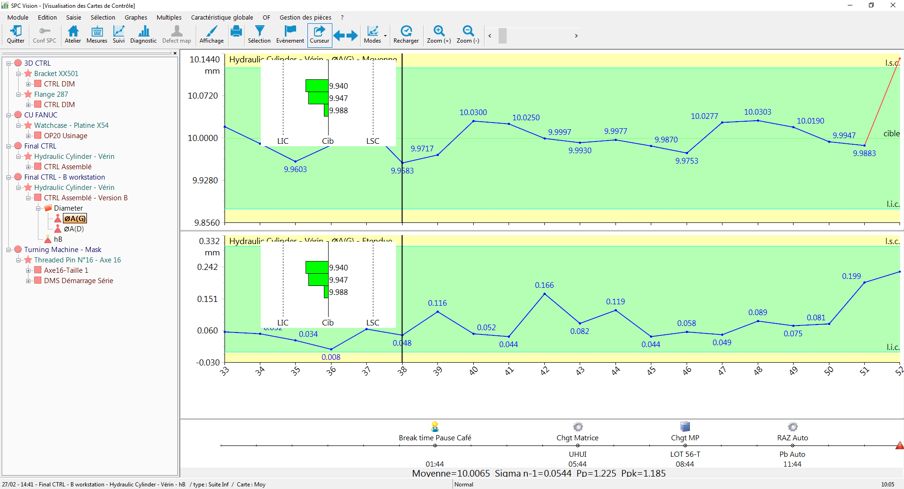
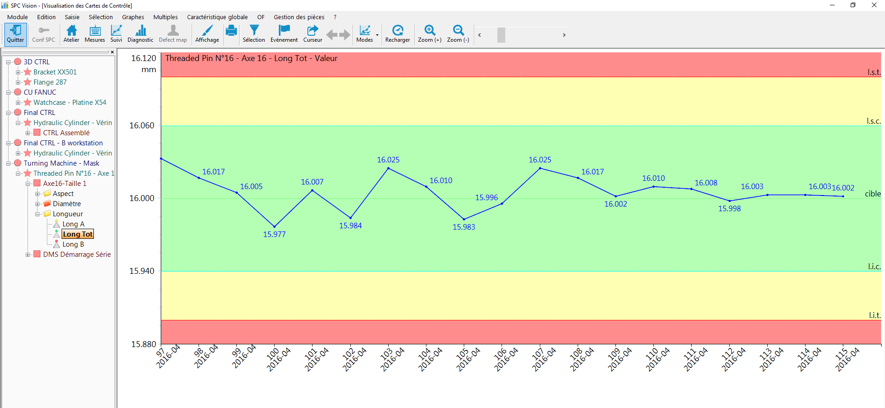
At the level of visualization, SPC charts for 100% inspection of individual parts have some clear differences with traditional sample charts:
- The ‘central tendency’ chart will display the individual measurement value for each part measured rather than an average of a subgroup sample. (sample size = 1, the measurement of a part will create a point on the chart)
- You can display the tolerance limits on the chart if wished since one displays individual values rather than an average. (However, you should ‘steer’ the process according to the control limits and accept / reject according to the tolerance limits).
Although perfectly valid, is perhaps not advisable to display specification limits on the control chart as it encourages unnecessary process adjustment (tampering). It is better to leave the process control function to the SPC control charts and the compliance function to the data collection / conformance process.
2: Manufacturing with automatic measuring process (sometimes at very high speed).
The distinction between the two functions mentioned above (compliance / steering) is essential in automated applications:
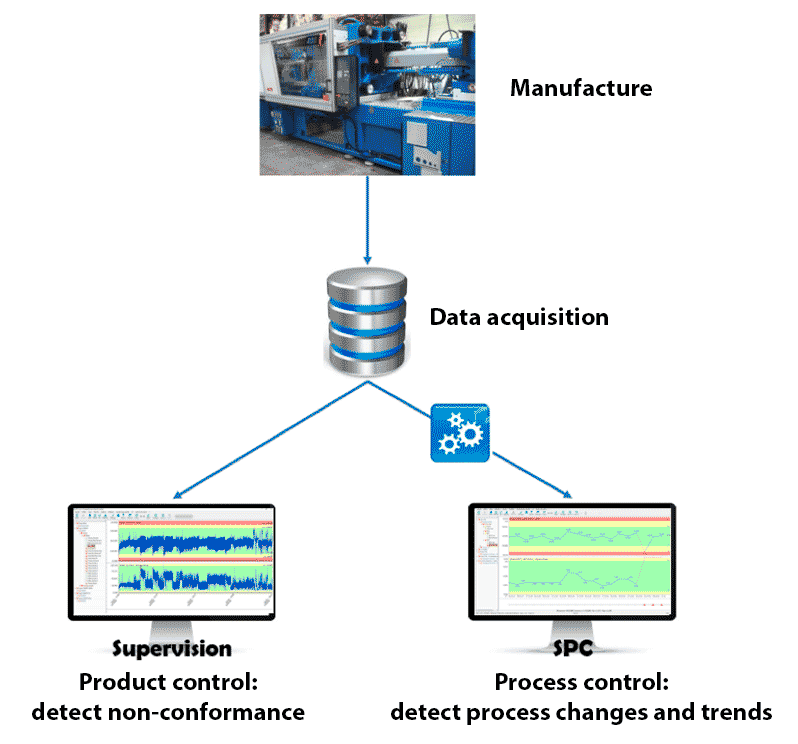
- Supervision (or traceability): an exact image of the process is displayed at a time t and its measurements and process parameters are kept for each part.
- SPC control: We convert and translate raw measurements into SPC measurements that detect trends, shifts, changes, adjustments, etc.
The problem is that often these two functions are often confused: We try to keep exhaustive measurement traceability within the SPC system or we try to make the SPC charts with a very high volume of data – several measurements per minute for example when there is no practical change in the process possible over this period.
These two functions must remain separate:
– The product supervision should be managed by the COMPLIANCE system (it is the automation or supervisor that ejects the detected non-compliant parts)
– The SPC process analysis and steering is maintained with the PILOTAGE function (with charts that eliminate the noise of high volume measurements and which make it possible to detect drifts, changes and short/long term trends).