
SPC and capability analysis of multi-head processes
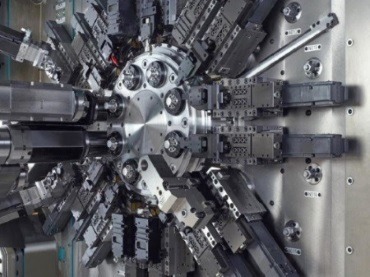
Multi-head processes are a common means of production that enable several parts to be produced in a single process cycle. Examples could include multi-spindle lathes, injection moulding, dosing and foundry applications – basically any process where multiple parts are manufactured at the same time.
Multi-head processes present a challenge in terms of quality assurance and particular care must be taken when devising a method for measuring process capability and ongoing process control using SPC.
The issue is that a multi-head machine needs to be thought of as a ‘single process’ and also as a number of mini elementary processes. Parts from each individual head will contain variation (within head variation) and also parts from one machine head will be different from another (between head variation)
Expanding on this point further, there are process factors (variables) which are specific to each head but also other factors which act on the process as a whole. For example,
Individual head – machine tool, tool wear and tool setting
Whole process – environmental factors, operators, process settings,
As with any other capability analysis and process control system, it is important that we identify and understand these variables and ensure we take them into account when developing our inspection and sampling plan.
Data collection and analysis
As mentioned above, it is important to ensure that when we collect data, our samples contain variation from all the process variables. Sometimes, for example during a process capability study, it may be necessary not to include ‘long term’ variables but from a process control point, the inspection plan should be devised to include all variables.
Once we have collected data, we have 2 options:
- To analyse each head individually
- Global analysis of all heads
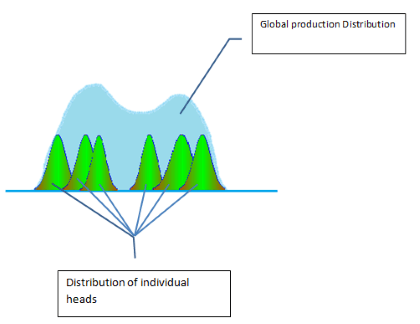
To allow us to investigate further we need to ask a key question:The diagram above roughly represents how our data distribution would look for each head and for the global process. As described above, the distribution contains the ‘within head’ variation and ‘between head’ variation.
Two questions now arise:
- « am I able to attach a part to an elementary process? »
- « What type of sampling should I or can I do? »
Am I able to associate a produced part to a specific head?
If the answer is ‘no’, then we must refer to our earlier investigations where we analysed how independent each head actually is from the others, and how many of the process factors are global and how many specific to each head. This will allow us to decide to what degree we can consider the process to be a single machine or a group of sub-machines.
If all the process variables are common and each head cannot be changed independently, then we could consider the machine as a whole and analyse the data for the ‘global process’ without risk of ‘missing’ data.
(In this case, we should still conduct a machine capability study to validate this and ensure parts are included from all heads)
However, if each head is independently variable, then we need to consider the machine as multiple individual processes and each head needs to be analysed and controlled separately.
(That is not to say we cannot take random samples in the future when the capability is known and the process is under control)
Inspection planning and sampling.
The first key point is to ensure that samples are manufactured under conditions which represent all the process variables (as described above). Assuming this is the case we could inspect parts from a multi-head machine in 2 ways:
- Collection of random parts from the total production
- Systematic sampling of parts from each head
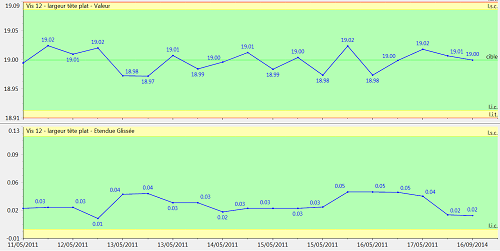
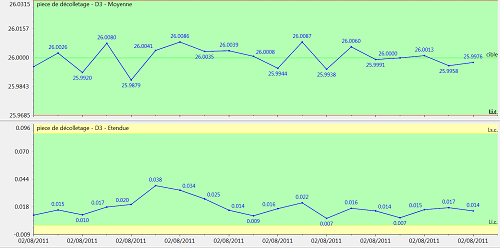
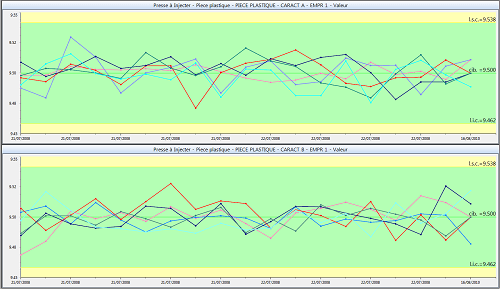
In the first case (random sampling of total production), it is possible to measure the overall process capability but this is not a good method for detecting special causes and controlling the process. This is because grouping samples from each head results in a high variability of the mean (see graph 1) and also potentially a non-normal distribution (because it is basically many normal distributions from each head mixed) (see graph 1).
The high variability will result in control limits which are wider than the ‘true’ control limits of each machine head and therefore, the global control chart will not be very effective at detecting small process changes.
However, if you have decided from earlier analysis that the machine can be thought of as a single processes rather than individual processes, then it is acceptable to sample global production in this way because the ‘between head’ variation is very small and any changes in the mean value will represent overall process drift (which is want the control chart to monitor)
Also, taking random samples in this way, does reflect the variability which the customer sees in the product and is a true reflection of the overall process capability.
In the second case (systematic sampling of each head), we find ourselves in a more favorable situation and if possible we should use this method even if we consider the machine as a single process. The average distributions of the elementary process should follow a normal distribution, and control charts will be very effective at detecting special causes as control limits will reflect the historical variation particular to the individual head rather than from the machine as a whole.
As the process capability increases and the process is ‘in control’, there could also be a third case where parts are randomly sampled along with the head traceability or parts systematically sampled from specific heads e.g.for a 64 headed process, we systematically collect data from heads 1, 12, 24, 32, 48 and 64. This is basically process sampling where it is possible to get a good reflection of the total process without measuring every head. (note: this is only possible after all the individual head process factors are being suitably controlled)
Some SPC Software (such as our Qualaxy SPC software) are flexible enough to cater for all these scenarios to provide powerful analysis and control charting to help you understand and control your multi-head machine.
Unitary controlfor each head(8machine heads = 8 control charts)
Global analysis for all heads
Additionally, you can display 2 other types of charts:
Multiple charts synchronised by time and displaying each head on the same charts
Transverse chart synchronised by machine head on x-axis
![]()
To summarise, we can say that SPC and process capability analysis is a great tool for measuring and controlling a multi-head process.
However, due to the increased complexity we must thoroughly investigate the process variables in order to decide the most effective sampling plan and analysis methods.
The key points are:
- Firstly, do we consider the multi-head machine as a single process (global) or a number of individual sub-processes. To determine this, we need to identify and analyse the process factors which will contribute to both ‘within head’ variation and ‘between head’ variation.
- Secondly, are we able to trace a manufactured part to a specific machine head. Depending on the answer to point one above, this could be critical. If we consider the machine to be multiple processes and we cannot trace the machine head then we will not be able to develop a robust control system.
- Thirdly, how should we analyse the data – globally for the whole machine or individually. Both are important because although the customer sees the overall variation from the process, it is important to control each head to ensure good quality using control charts.
- Finally, SPC software allows you to maximise the charting and analysis possibilities helping you understand and control the process more effectively.
Frédéric Henrionnet
Ct Infodream
References:
– Apply statistical process control SPC / SPC , Maurice Pillet
– The screenshots were done using our Qualaxy SPC software