What is inertial tolerancing?
In this article, we will discuss the concept of inertial tolerancing. We will see how this way of tolerancing applies to the characteristics of a part but also to the control of processes using control charts.
Definition of inertial tolerancing
Inertial tolerancing is a concept developed by Maurice Pillet at the University of Savoie. It is based on a simple observation: the current tolerance system is not always adapted to.
In the worst case, it sometimes imposes tolerances that are impossible to maintain in production, or at too high a cost.
Statistical tolerancing allows tolerances to be extended by taking into account the unlikely cases of parts being assembled at the extreme edge of tolerance. It presupposes the correct centring of the production, and the unlikely cases become much more probable at the slightest decentring.

The basic idea is therefore to return to the Taguchi loss function
The cost is minimised when you are on target. The objective is no longer to put the characteristic within a tolerance interval, but as close as possible to the target!
The inertia is calculated as a function of the standard deviation and the deviation from the output target. You can allow for more dispersion if you are well centred.
Similarly, it is possible to accept a decentring of the average if the dispersion is low. This makes it possible to guarantee the final robustness of the finished product whatever the batches of parts used. This is provided that the specified inertias on these batches are respected..
What does inertial tolerancing offer?
Inertial tolerancing therefore offers :
• another way to tolerate with tolerances:
– inertial : 10 0,003 STI
– arithmetic : 10 ±0,01
– statistics : 10 ±0,01 STQ
• other indicators such as :
– I (Inertia)
– Cpi / Ppi (inertial capability)
• but above all a different way of thinking, a new paradigm :
– the aim is to limit the variability around the target (the target is placed in the centre) ;
– we get out of the inconsistency of classical tolerancing. Indeed, the latter explains that sometimes it is necessary to adjust while the products are good (in the sense of conformity). And that sometimes you have to leave the process when the products are not good (still in the sense of conformity) !
Inertial tolerancing for process control
The next step is naturally to move on to inertial process control.
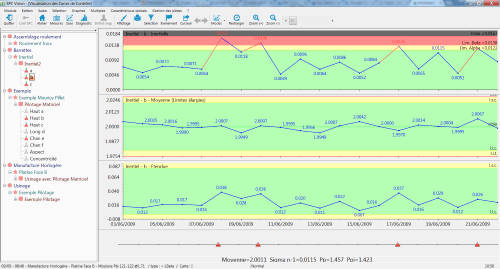
The process control involves the establishment of a control chart, where the inertia of the samples is monitored. This control chart will have 4 zones (green, orange, red and black) each determining a different action to be carried out according to the position of the point.

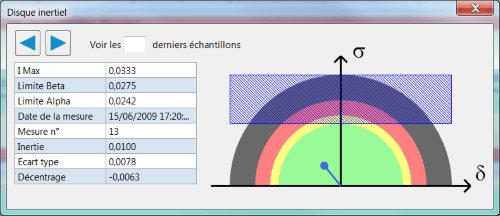
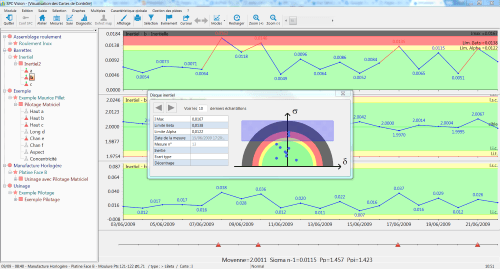
The sample can also be viewed in a ½ inertial circle. The dispersion is on the ordinate, and the centring on the abscissa. These 2 simultaneous dimensions allow the sample to be perceived at a glance.

Inertial piloting is bound to change habits. This change is deliberate and accepted because « you have to be close to the target » and not « you just have to be within the tolerances ».
However, in order to maintain the visualization of the classic Shewart charts, we at Infodream have decided to offer a triplet of charts:
– inertial steering
– averages
– standard deviations

Inertial tolerancing for industrial process control
The application of all these steps forms what Maurice Pillet calls « Inertial Process Control ».
These steps are defined and exist in our Qualaxy SPC software:
• Definition of the characteristics
• Calculation of an inertial tolerance
• Determination of extended limits and/or inertial limits
• Control with the 4 zone inertial control chart
• Visualisation of the ½ inertial circle sample / sample or on a population
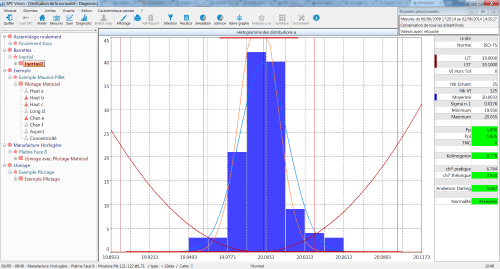
• Histogram analysis with mean excursion segment and dispersion segment allowed.
• Calculation of inertial capability indicators

What are the applications of inertial process control?
• Assembly of parts with worst-case tolerances that are too tights
• Plastic injection moulding
• Multi-cavity
The purpose of this article is to present the concept of « Inertial Process Control » in a general way. All calculation formulas, other statistical notions and steering rules have been deliberately omitted.
Frédéric Henrionnet
CT Infodream
Sources :
- Standard NF XP E 04-008 / UNM 08D-038
- Maurice Pillet’s work on the subject
- Screenshots from Qualaxy SPC software